The need
Asset managers need to see underperforming elements in context. It is not enough to know that there is an issue: understanding when and where underperformance happens allows them to assess the situation, in order to address it efficiently.
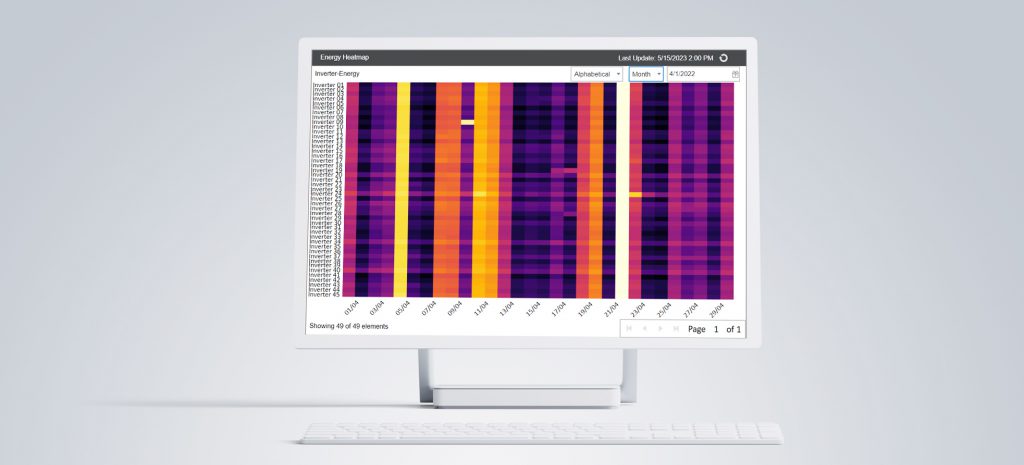
Our solution
The Heatmap module displays historical aggregated data at the element level (for example, inverters or wind turbines). This allows asset managers to identify the exact time and location of underperformance in their portfolio. allowing you to evaluate and address inefficiencies at the level of individual elements.
By default, the Heatmap displays three types of data: availability, energy, and production ratio. Users can easily sort the data by whichever criteria is most relevant to them, and they can request specific configurations to customize the color-code of the percentage ranges, as well as other types of data.
This development is the brainchild of Jorge López, an energy engineer with several years of experience in renewable assets. As someone with first-hand experience as a power-plant controller, he understands the importance of processing and presenting data in the most useful and actionable ways possible.
“When diving down into underperforming analysis it is vital to have access to the specific data of all equipment on-site, but also to make use of visualizations which help with the exploration process. Heatmaps greatly help with this workflow and allows for quick spotting of issues but also efficient reporting.”
Jorge López, Product Manager at GreenPowerMonitor, a DNV company