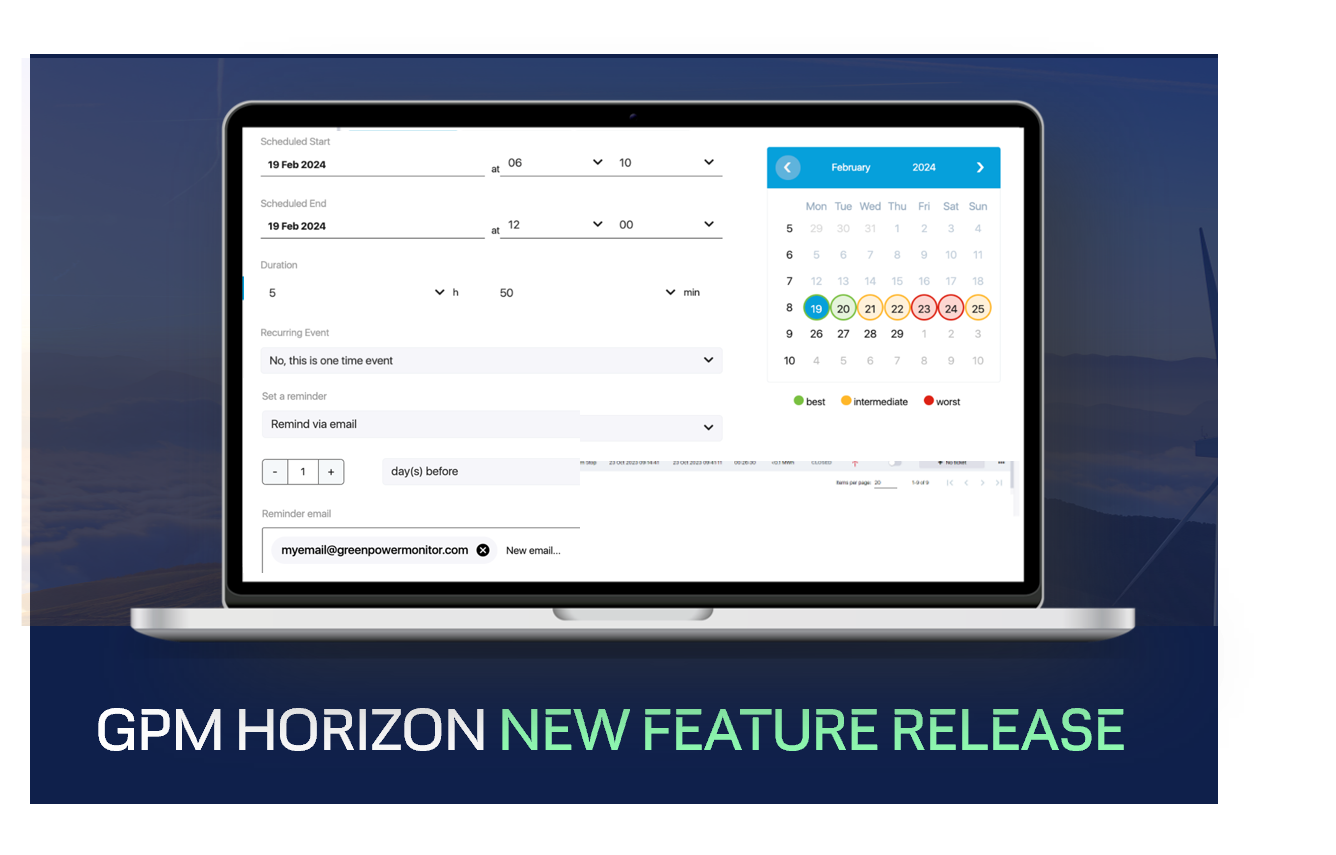
Managing renewable energy effectively demands more than just cutting-edge technology—it necessitates a profound comprehension of the distinct hurdles encountered by asset managers and owners. In an industry where operational efficiency and minimizing production loss are paramount, the implementation of intelligent, user-friendly solutions is pivotal. Within our versatile GPM Horizon platform, we’ve introduced a cutting-edge feature to address these needs: visual timeslot optimization. This capability streamlines the planning process, guaranteeing minimal disruption to renewable energy production.
Problem description: the challenge of optimal event planning
A substantial challenge in renewable energy management is scheduling planned events, such as maintenance, inspections, or upgrades, without impacting energy production. Traditional methods often involve a manual review of production forecasts, operational schedules, and historical data—a time-consuming and sometimes imprecise process.
This complexity is compounded by the inherent variability of renewable energy sources, where factors like weather conditions can dramatically influence production efficiency. Asset managers are faced with the dual challenge of maintaining high operational standards while also maximizing energy output, a task that requires precise planning and a deep understanding of the production landscape.
The need for a solution that can navigate these complexities, offering clear, data-driven recommendations for event scheduling, is evident. The goal is not only to streamline the planning process but also to provide asset managers with tools that are both powerful and accessible, enabling informed decision-making that aligns with production optimization goals.
Key challenges:
- Minimizing production loss: the primary objective in scheduling planned events is to minimize production loss. Every hour of downtime can result in significant financial and energy production impacts. Therefore, identifying optimal times for these events becomes a critical task for asset managers.
- Operational efficiency: beyond minimizing production loss, there is a need to ensure that the planning and execution of events are carried out as efficiently as possible. This includes managing resources, coordinating teams, and complying with regulatory requirements—all while adhering to a schedule that aligns with optimal production forecasts.
- Data overload: asset managers often have access to vast amounts of data, including weather forecasts, historical production data, and predictive maintenance schedules. The challenge lies in effectively analyzing this data to make informed decisions about when to schedule planned events.
- User experience: many existing tools for event planning in the renewable energy sector are either overly complex, requiring significant technical expertise to navigate, or too simplistic, lacking the depth of analysis needed to make informed decisions. Finding a balance that offers both sophistication and usability is crucial.
User-centric design for optimized event planning
Acknowledging the challenges mentioned above, the GPM Horizon platform now presents a solution that combines intuitive design with advanced analytical capabilities. This feature revolves around a straightforward yet potent concept: providing users with visual recommendations for the most optimal timeslot when scheduling a new planned event, thus simplifying the selection process for a period with minimal production loss.
Main settings: precision in planning
The following settings are available when creating planned events in GPM Horizon:
- Event category: allows users to classify the event according to its nature or purpose, such as maintenance, inspection, environmental, grid limitation, etc. This classification helps to organize events more effectively, enabling users to filter and search through the calendar. It also aids in analyzing the impact of diverse types of events on production efficiency and asset performance over time. For limited production, users can also define the needed power limit.
- Asset selection: enables users to specify which renewable energy assets (e.g., wind turbines) the planned event will affect. This can range from selecting a single asset to multiple assets.
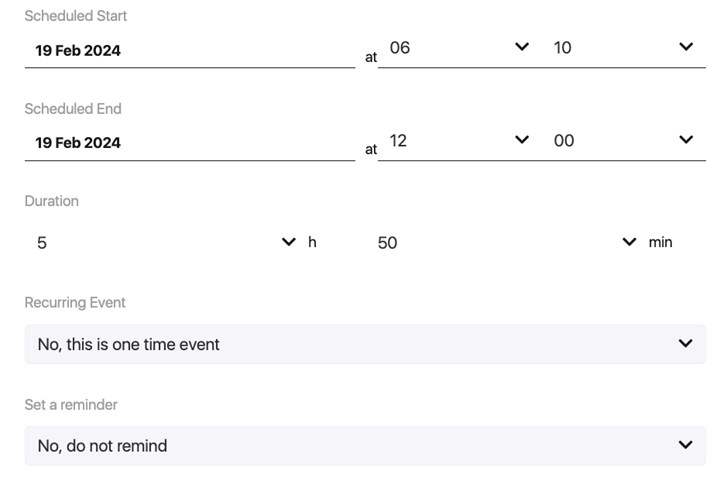
- Start / End time + Duration: users must define the start and end times for the event. The platform’s visual suggestion feature helps select the optimal timeslot, considering the event’s duration and the impact on production.
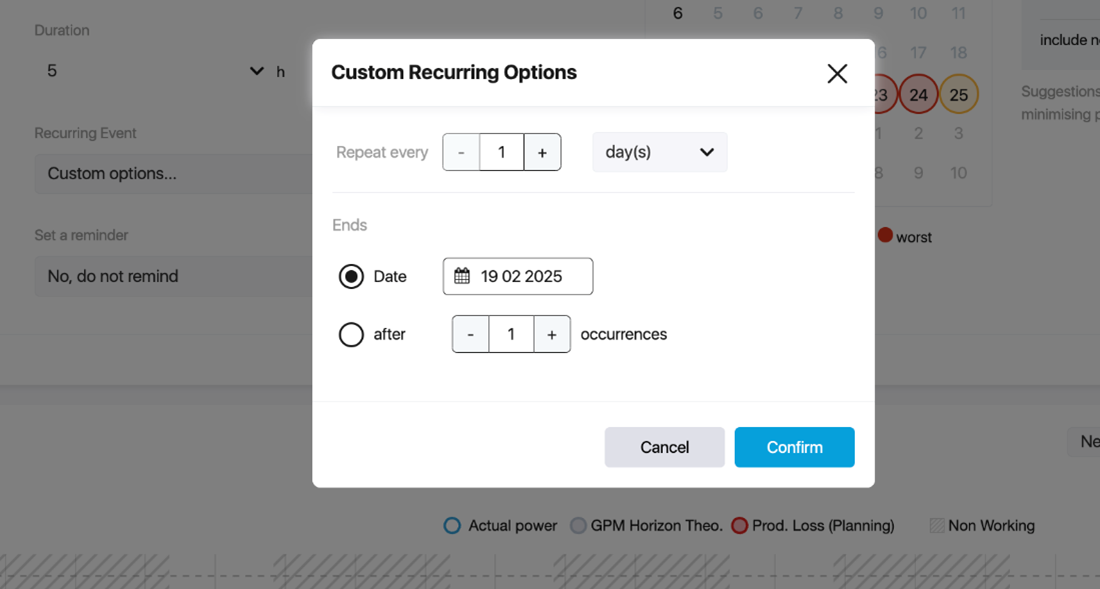
- Recurring options: allow users to schedule events that need to occur at regular intervals, such as quarterly maintenance checks. Users can define the recurrence pattern (e.g., daily, weekly, monthly, yearly) and specify an end date or number of occurrences.
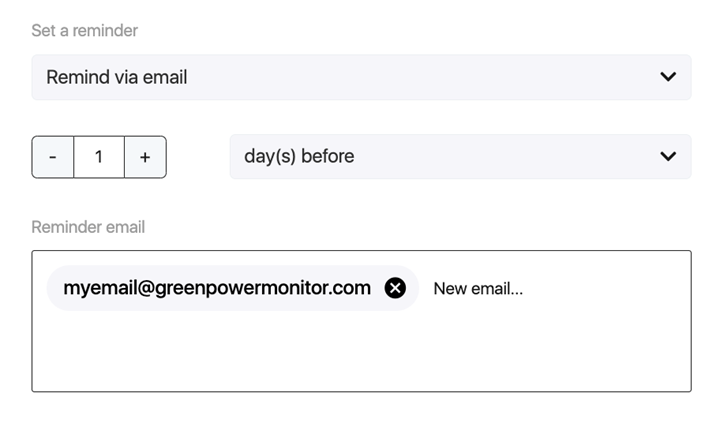
- Reminders: enables users to set up notifications related to the event. E-mail reminders for all relevant stakeholders can be configured for at specific times before the event starts.
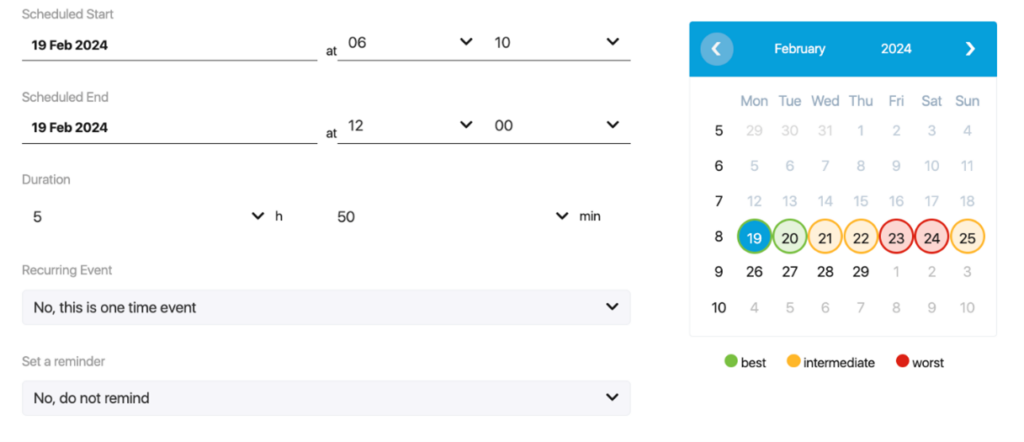
Intuitive insights: color-coded calendar visualization
The color-coded calendar visualization transforms the way asset managers approach the planning of maintenance and other planned events. By integrating a visual forecast into the calendar, with days highlighted in green, orange, and red to represent the best, intermediate, and worst times for scheduling, the platform makes it immediately apparent which days are most favorable.
The simplicity of the color-coded system belies the complex analytics that power it, delivering at-a-glance insights that would otherwise require in-depth analysis.
Streamlined decision-making: optimal timeslot suggestions
Upon entering the event duration, users are presented with three optimal timeslot suggestions, calculated based on a comprehensive analysis of available data. This feature streamlines the decision-making process by automatically identifying and presenting the best timeslots for an event, considering both production impact and operational constraints.
- Estimated production loss: when planning an event, the platform calculates the expected reduction in energy production based on the asset’s historical performance data, the nature of the event (e.g., maintenance downtime), and relevant environmental factors. This calculation considers the event’s duration, timing, and the specific assets involved.
- Estimated revenue loss: building on the estimated production loss, the platform further computes the potential revenue loss associated with the event. The result is a clear
,monetary value that represents the direct monetary impact of scheduling the event at a specific time.
Given below is an example of how placing a 3-hour long event on different days impacts the potential losses:
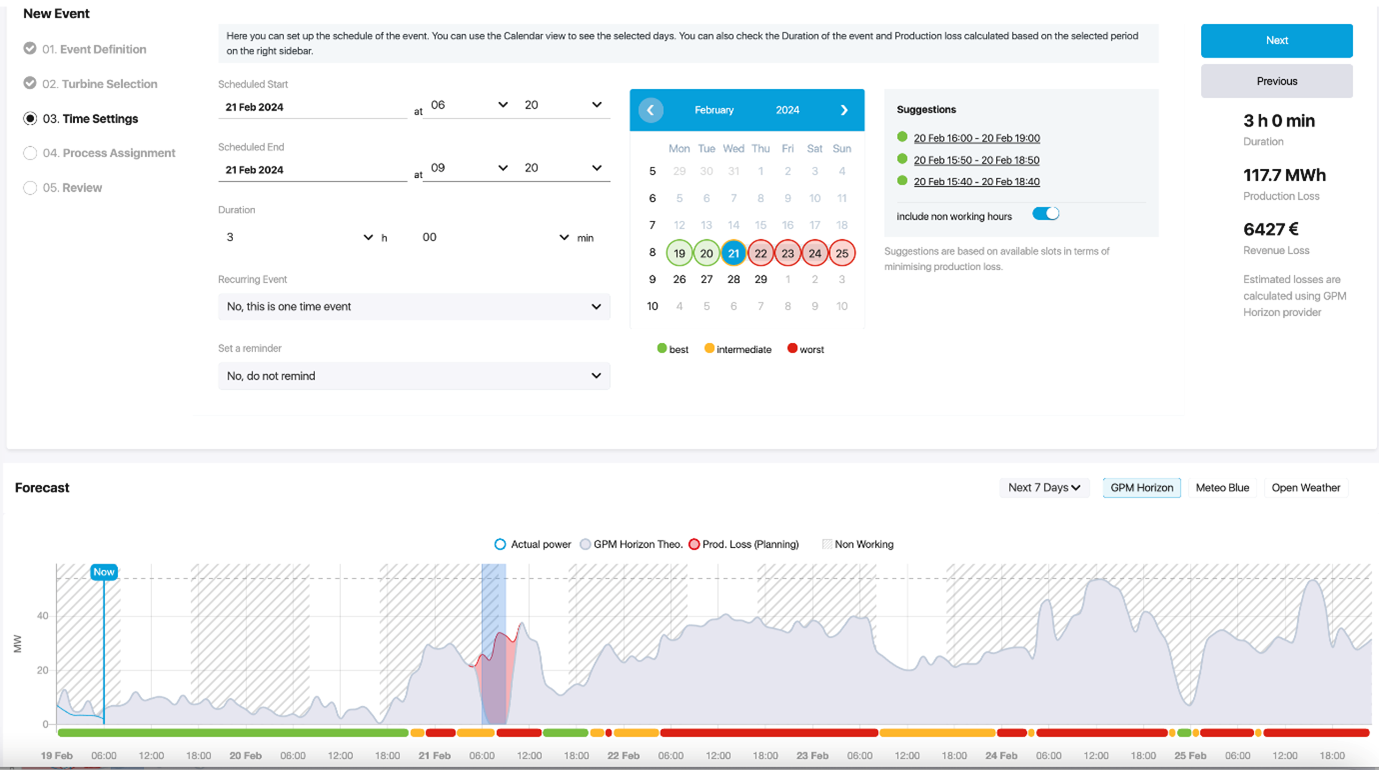
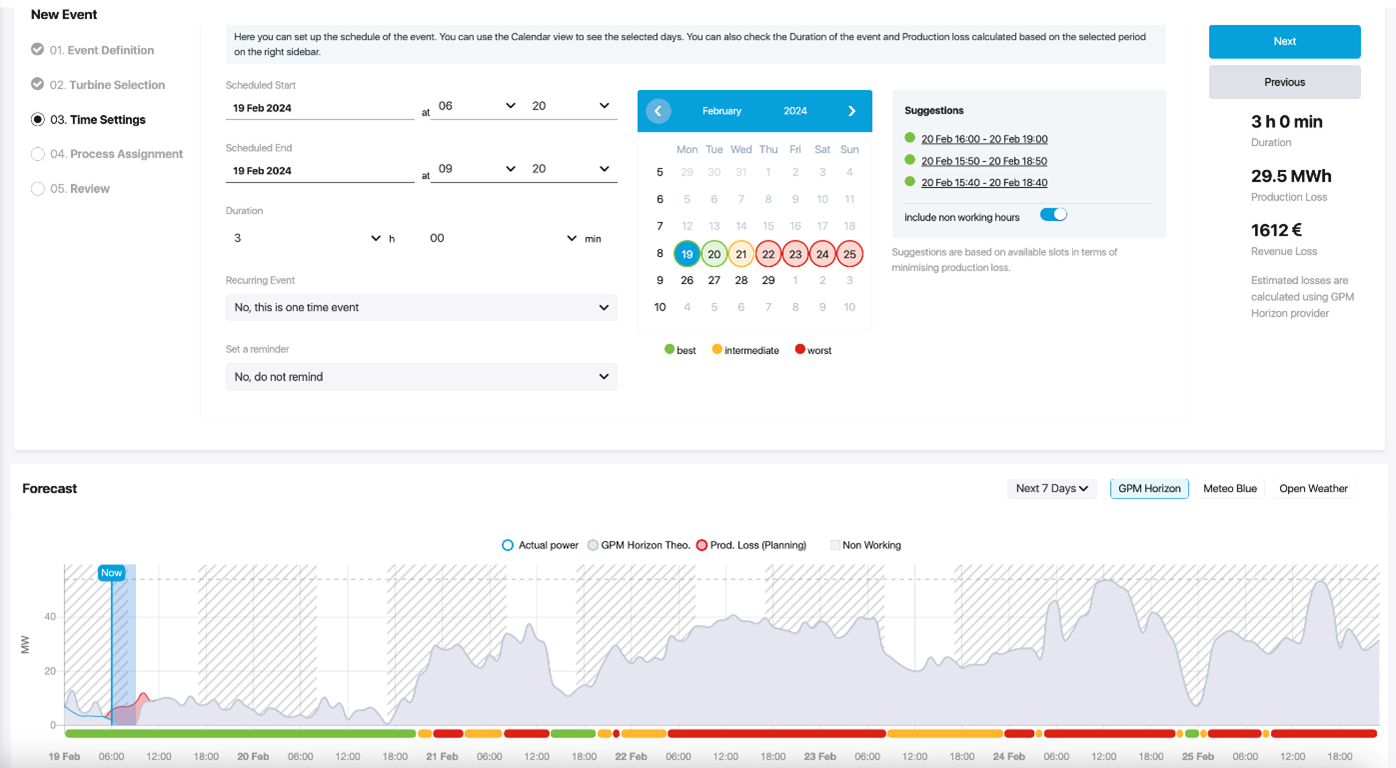
The switch control adds another layer of customization by allowing you to factor in or exclude non-working hours in the suggestions. This ensures that the recommendations align with the operational schedules and preferences of the asset management team. This integration of user preferences with data-driven insights exemplifies our platform’s commitment to delivering practical, actionable solutions.
Beyond the basics: Forecast chart for detailed analysis
The Forecast chart (in screenshots above) offers a detailed visual analysis tool that extends the capabilities of the color-coded calendar, providing a granular view of the entire visible period categorized into the best, intermediate, and worst times for event planning. With a minimum resolution of one hour, this chart allows users to dissect time periods within the forecast range, offering insights into hourly fluctuations in production forecasts. This level of detail is invaluable for asset managers who need to consider the nuances of renewable energy production, such as the variability introduced by changing weather patterns.
Maximizing value through smart features
The integration of visual suggestions for optimizing event timeslots represents more than just a feature update—it signifies a strategic advancement tailored to address the specific requirements of renewable energy asset managers. Furthermore, this functionality illustrates the seamless integration of data-driven insights into user workflows, facilitating proactive management of renewable assets. By prioritizing the end-user experience and leveraging advanced analytics, the platform transcends mere operational efficiency enhancements to support the overarching objective of maximizing renewable energy production.
This functionality is a clear indication of GPM’s commitment to delivering innovative features that meet and provide value to the evolving needs of renewable asset managers and owners, paving the way for a more sustainable and efficient future in renewable energy management. GPM Horizon ensures that scheduled events are aligned with times that minimize production disruption, directly contributing to increased operational efficiency and energy output.