Leading the green energy transition with datA-driven digital solutions
Best-in-class solutions to manage, monitor and control renewable assets.
User-focused asset management solutions that enable the optimization of preventive and corrective actions.
ASSET MANAGERS,
OPERATION AND MAINTENANCE
Well-planned and executed operations
ASSET OWNERS
Long-term investment and performance maximization
ENGINEERING, PROCUREMENT AND CONSTRUCTION
High-performing commercial projects

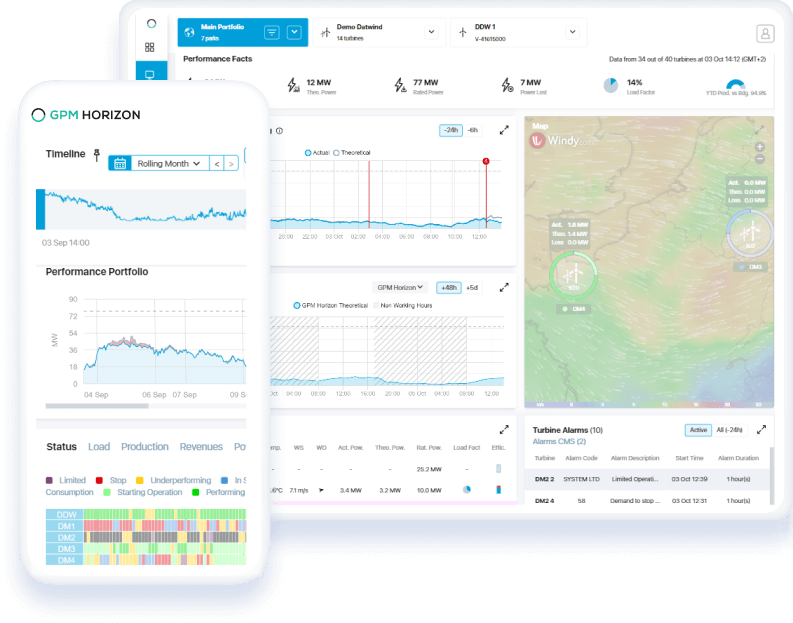
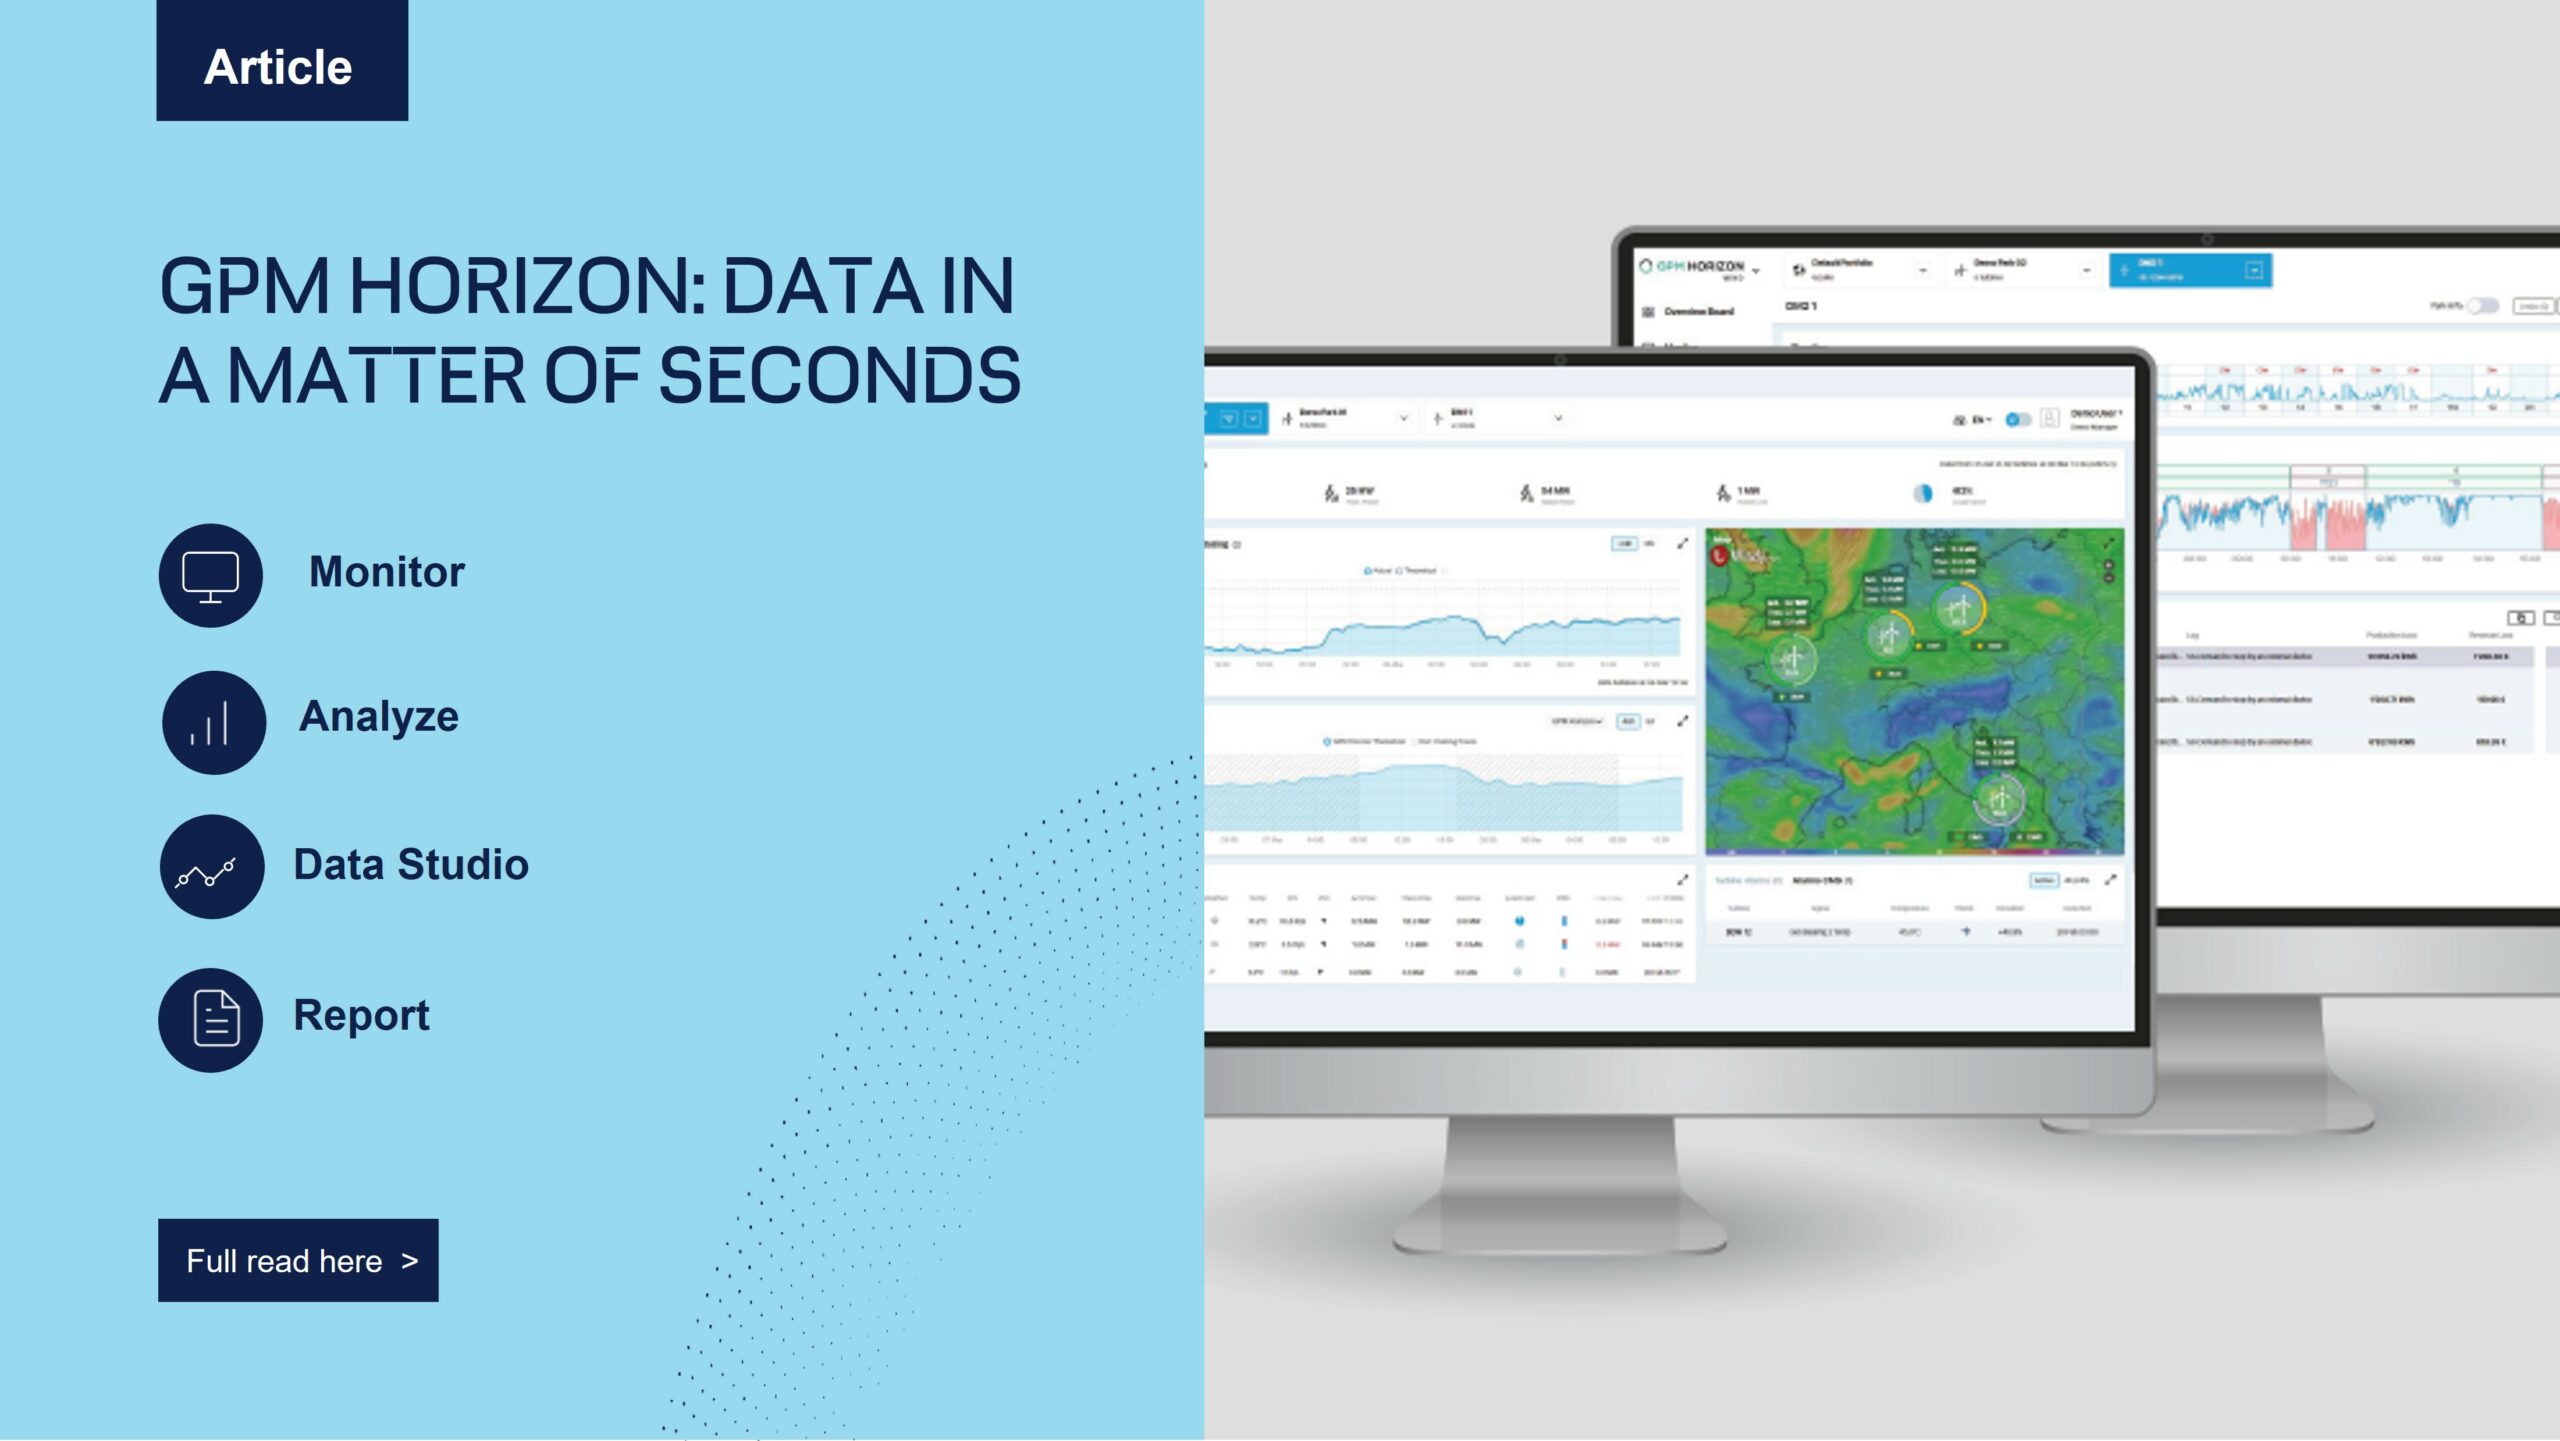
How do you choose the ideal Horizon modules to optimize energy production?
Subscribe exclusively to the modules aligned with your asset management objectives. GPM Horizon seamlessly integrates with second-level SCADA and DAS systems.
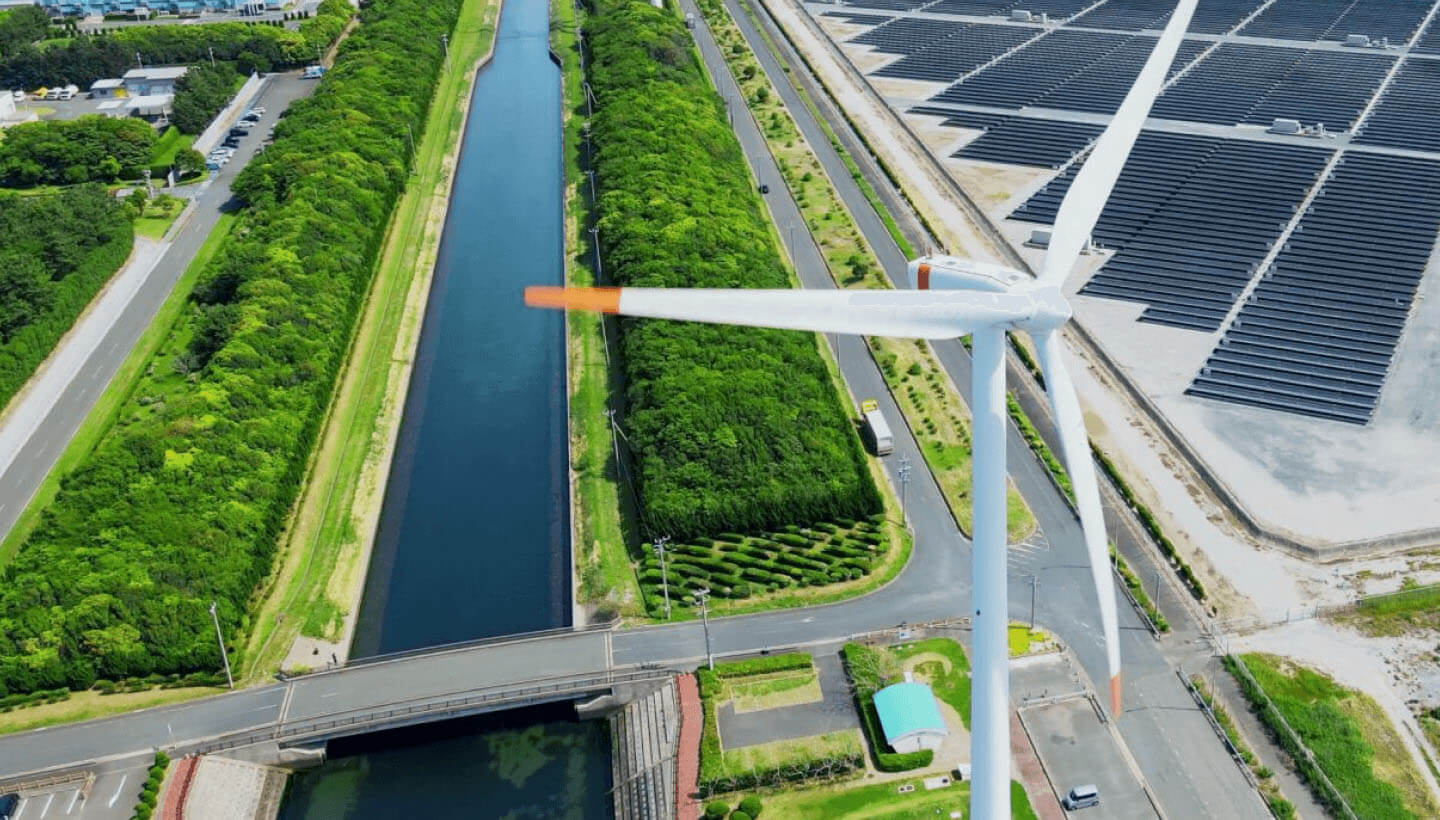
We are experts in managing utility-scale renewable energy power plants.
7500+
FACILITIES
90+
COUNTRIES
73+
GIGAWATTS
Our customers
We solve energy management problems.
You get results.
Accelerating efficiency in solar, wind, storage facilities around the globe.
Sign up to our newsletter!
Stay informed with exclusive updates, events, industry insights, and more.
Latest global news, events, and resources
-

GreenPowerMonitor will attend Intersolar Middle East and World Future Energy Summit, both will be held from April 16 to 18 in Dubai and Abu Dhabi respectively. Do…
Energy | Energy Transition | Intersolar | Renewable energy | Renewable energy asset management | Renewables | solar | wind | World Future Eenrgy
-
Power generation has rapidly changed in recent years. Electrification is on course to double in size within a generation and renewables are already the most…
-

Market situation The demand for effective and efficient monitoring and maintenance solutions for wind turbines is on the increase as the adoption of wind energy continues…
-
Market insights The renewable energy market is growing rapidly due to the global push for decarbonization and sustainability. This demand for efficient monitoring and analysis…
-

GreenPowerMonitor will attend Solar+Storage Mexico 2024, to be held on 17 – 19 April in Guadalajara, Mexico. Solar+Storage Mexico is an exhibition specialized in the energy storage and solar…
Energy | Energy Transition | Renewable energy | Renewable energy asset management | solar | Solar energy | Storage | Storage energy